CUSTOMER DATA
- SDK
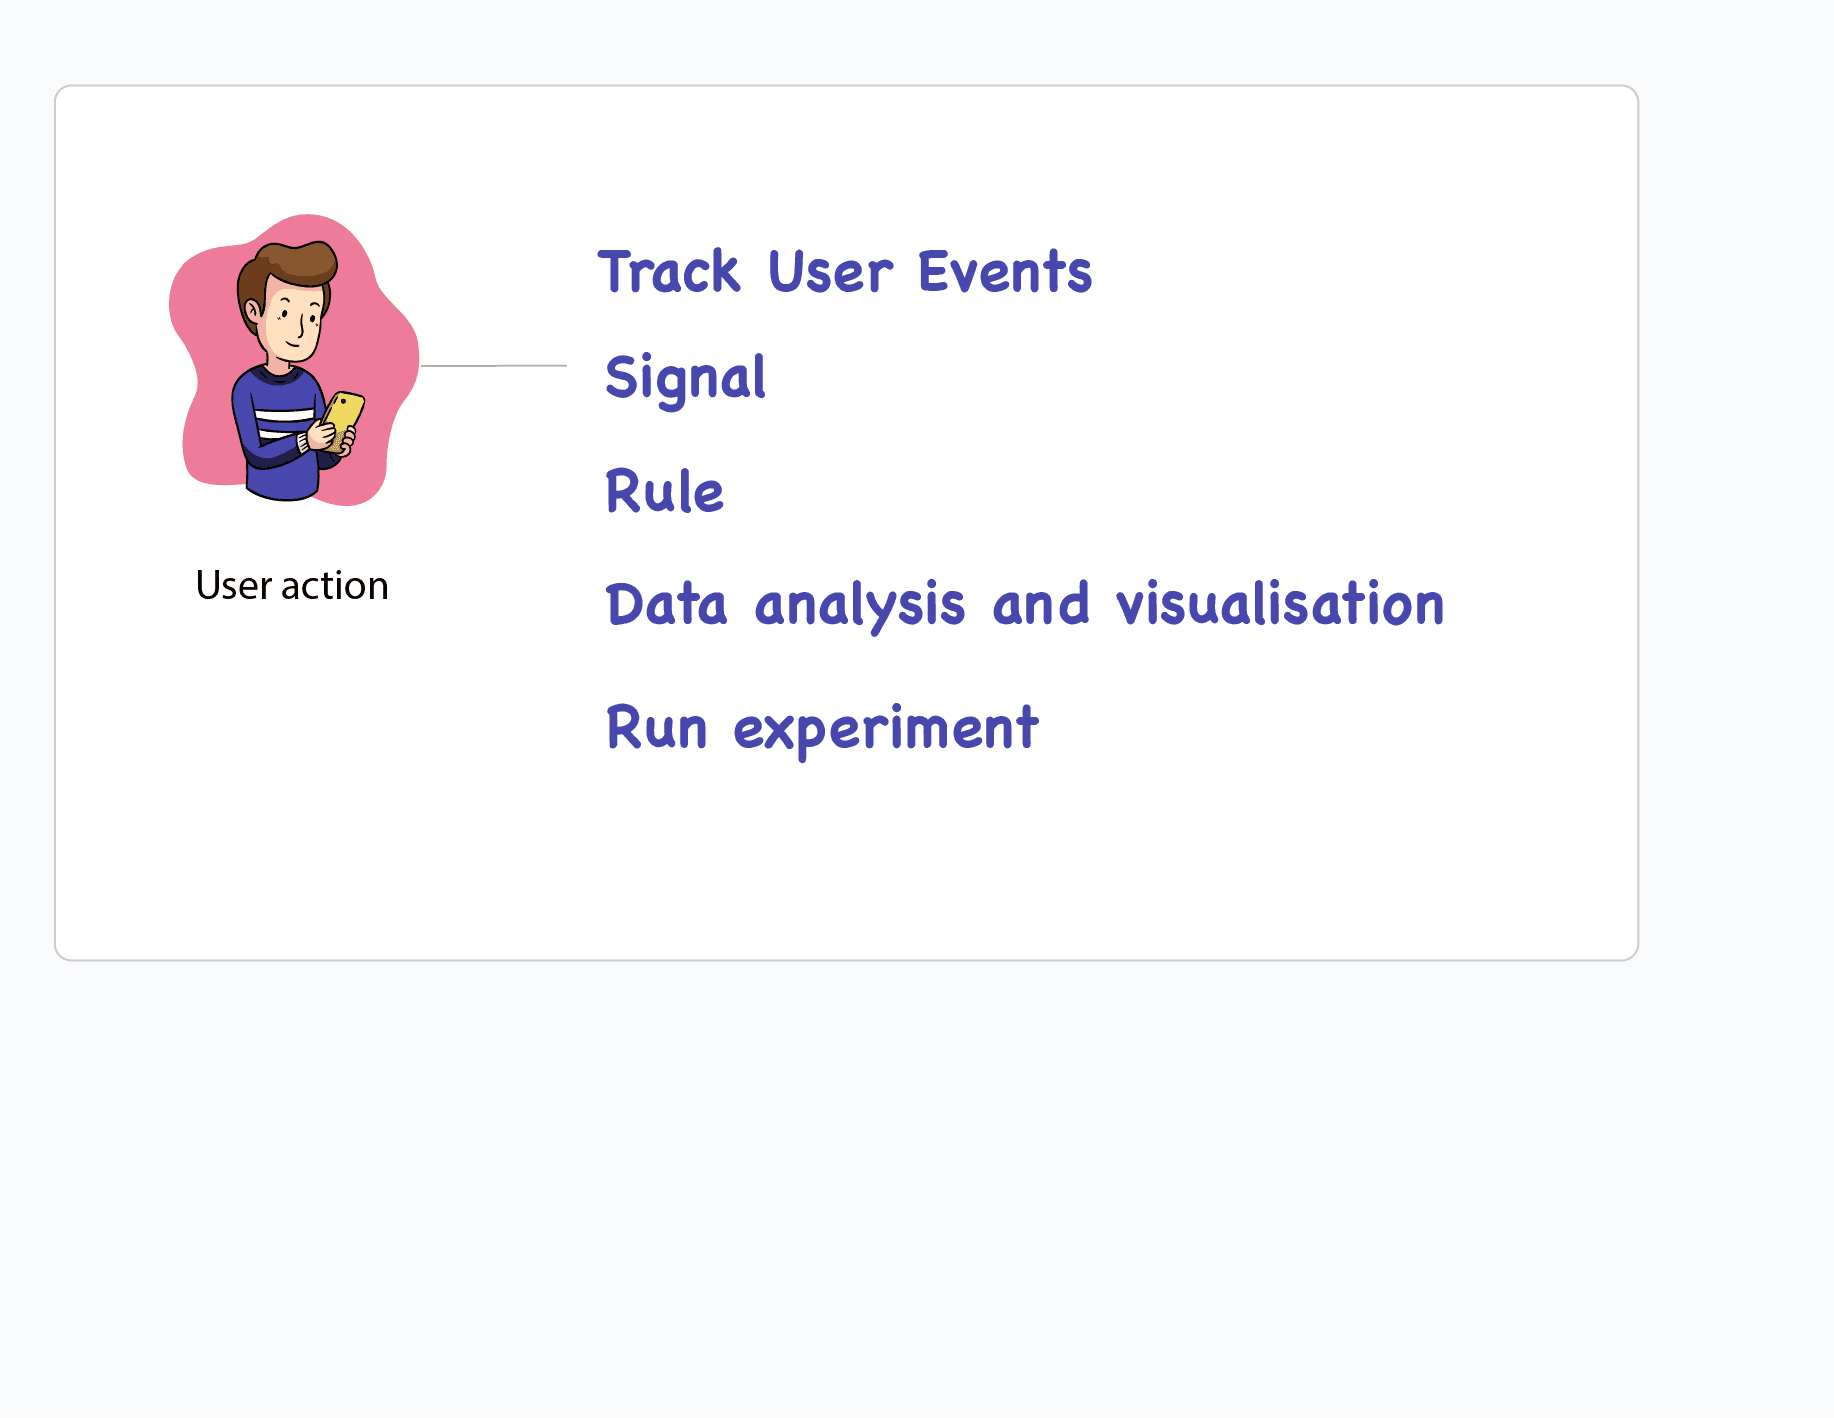
Track event
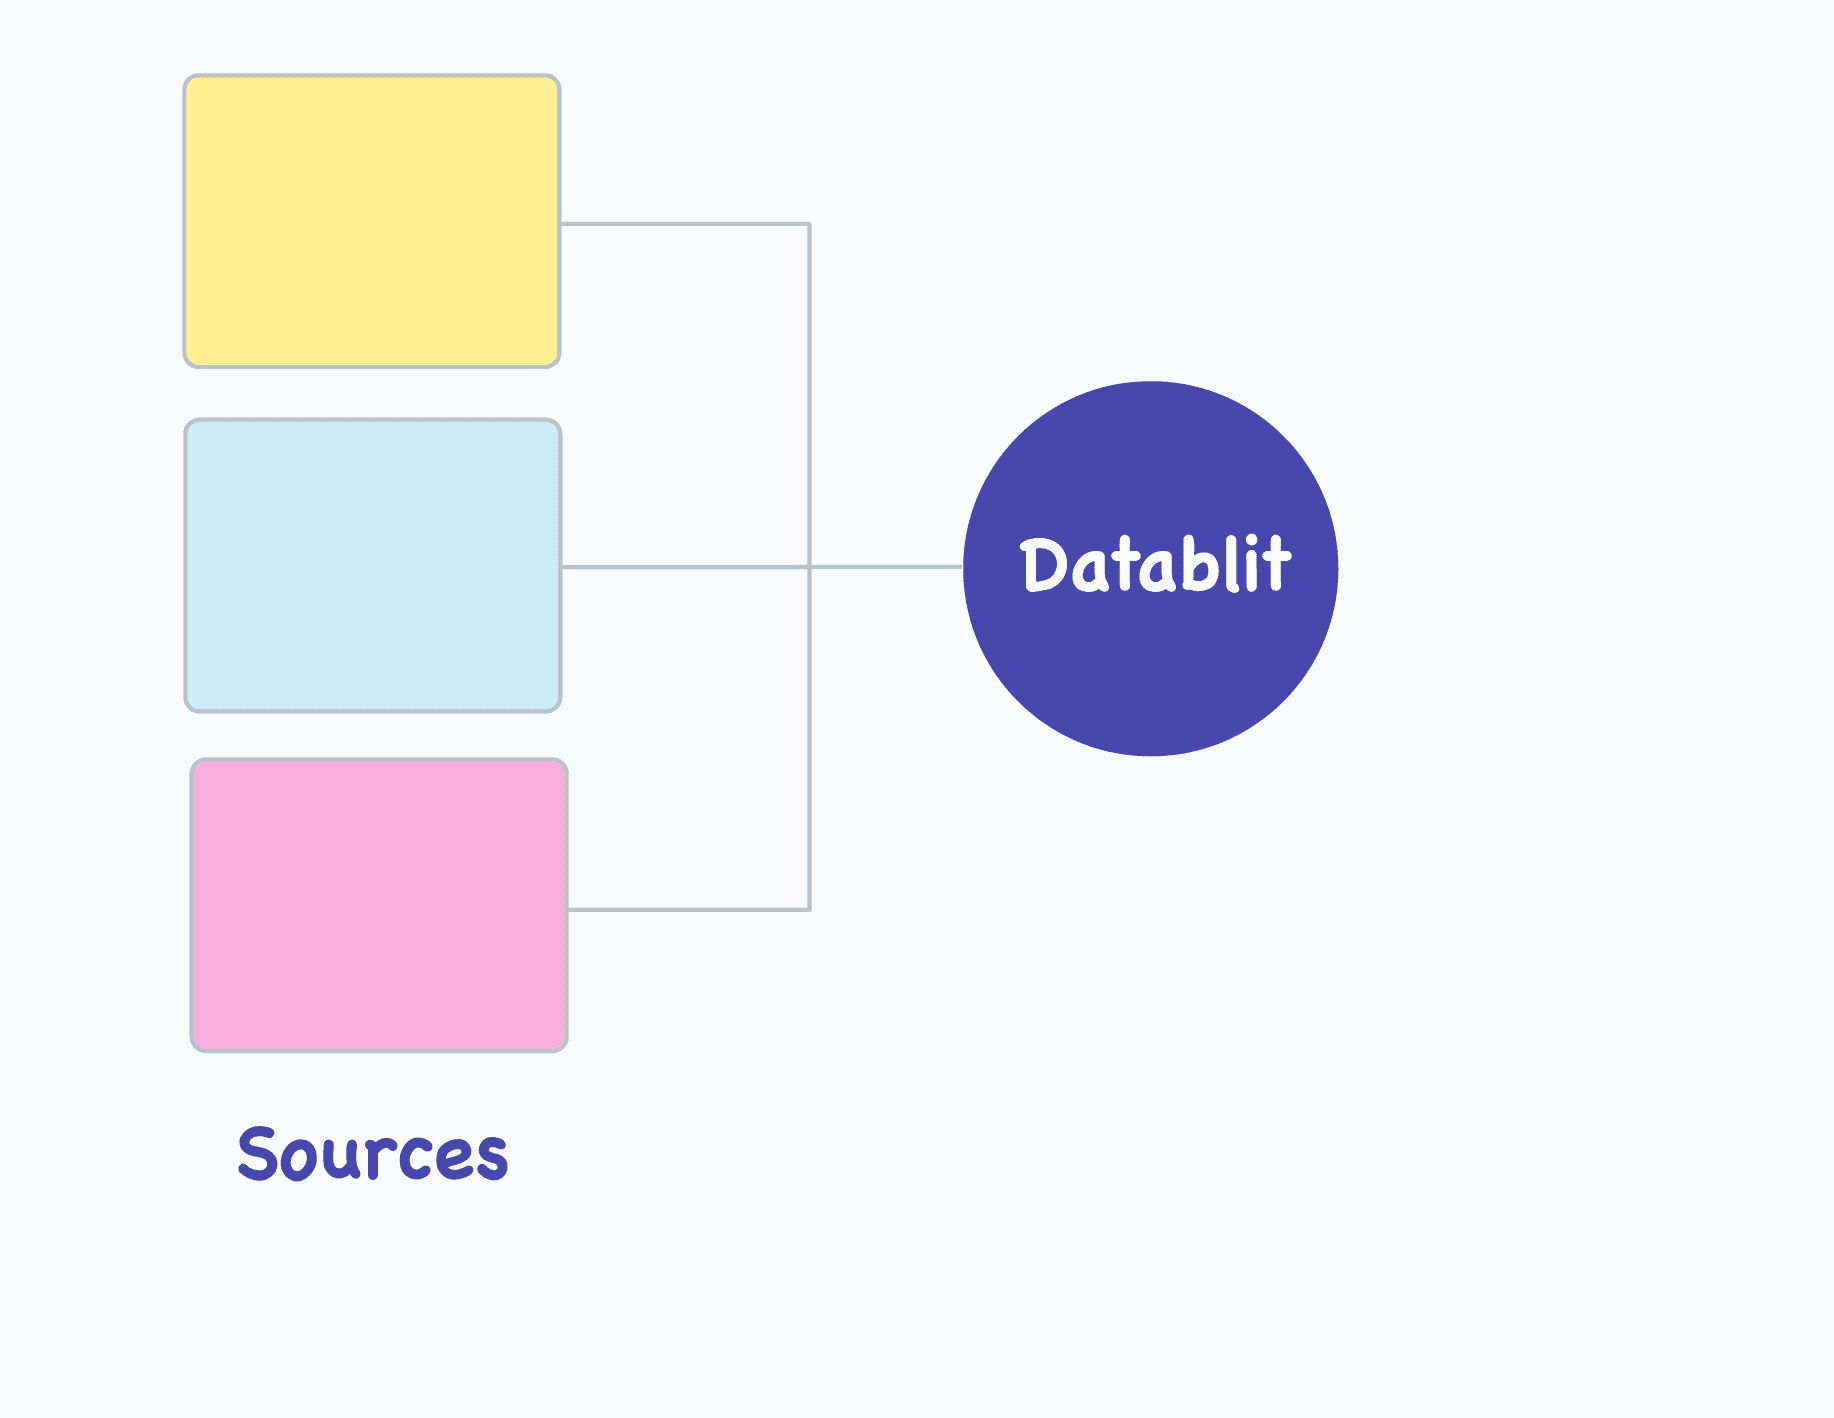
- Data Ingestion
Collect data from multiple sources
- Signal
Track custom metrics
- Rule
Logical expression governing business decision
- Data analytics and visualisation
Unlock insight with SQL analysis and interactive graphs
- Experiment
Test and validate hypothesis before rollout
- User Profile
Dive deep into the user journey
BOOST PRODUCTIVITY
DATABLIT
Turns weeks of engineering effort into minutes of business action.
Learn more →- SDK
- Docs
- Blog
- Use Cases
- Compare
- Community
- Academy
- Pricing
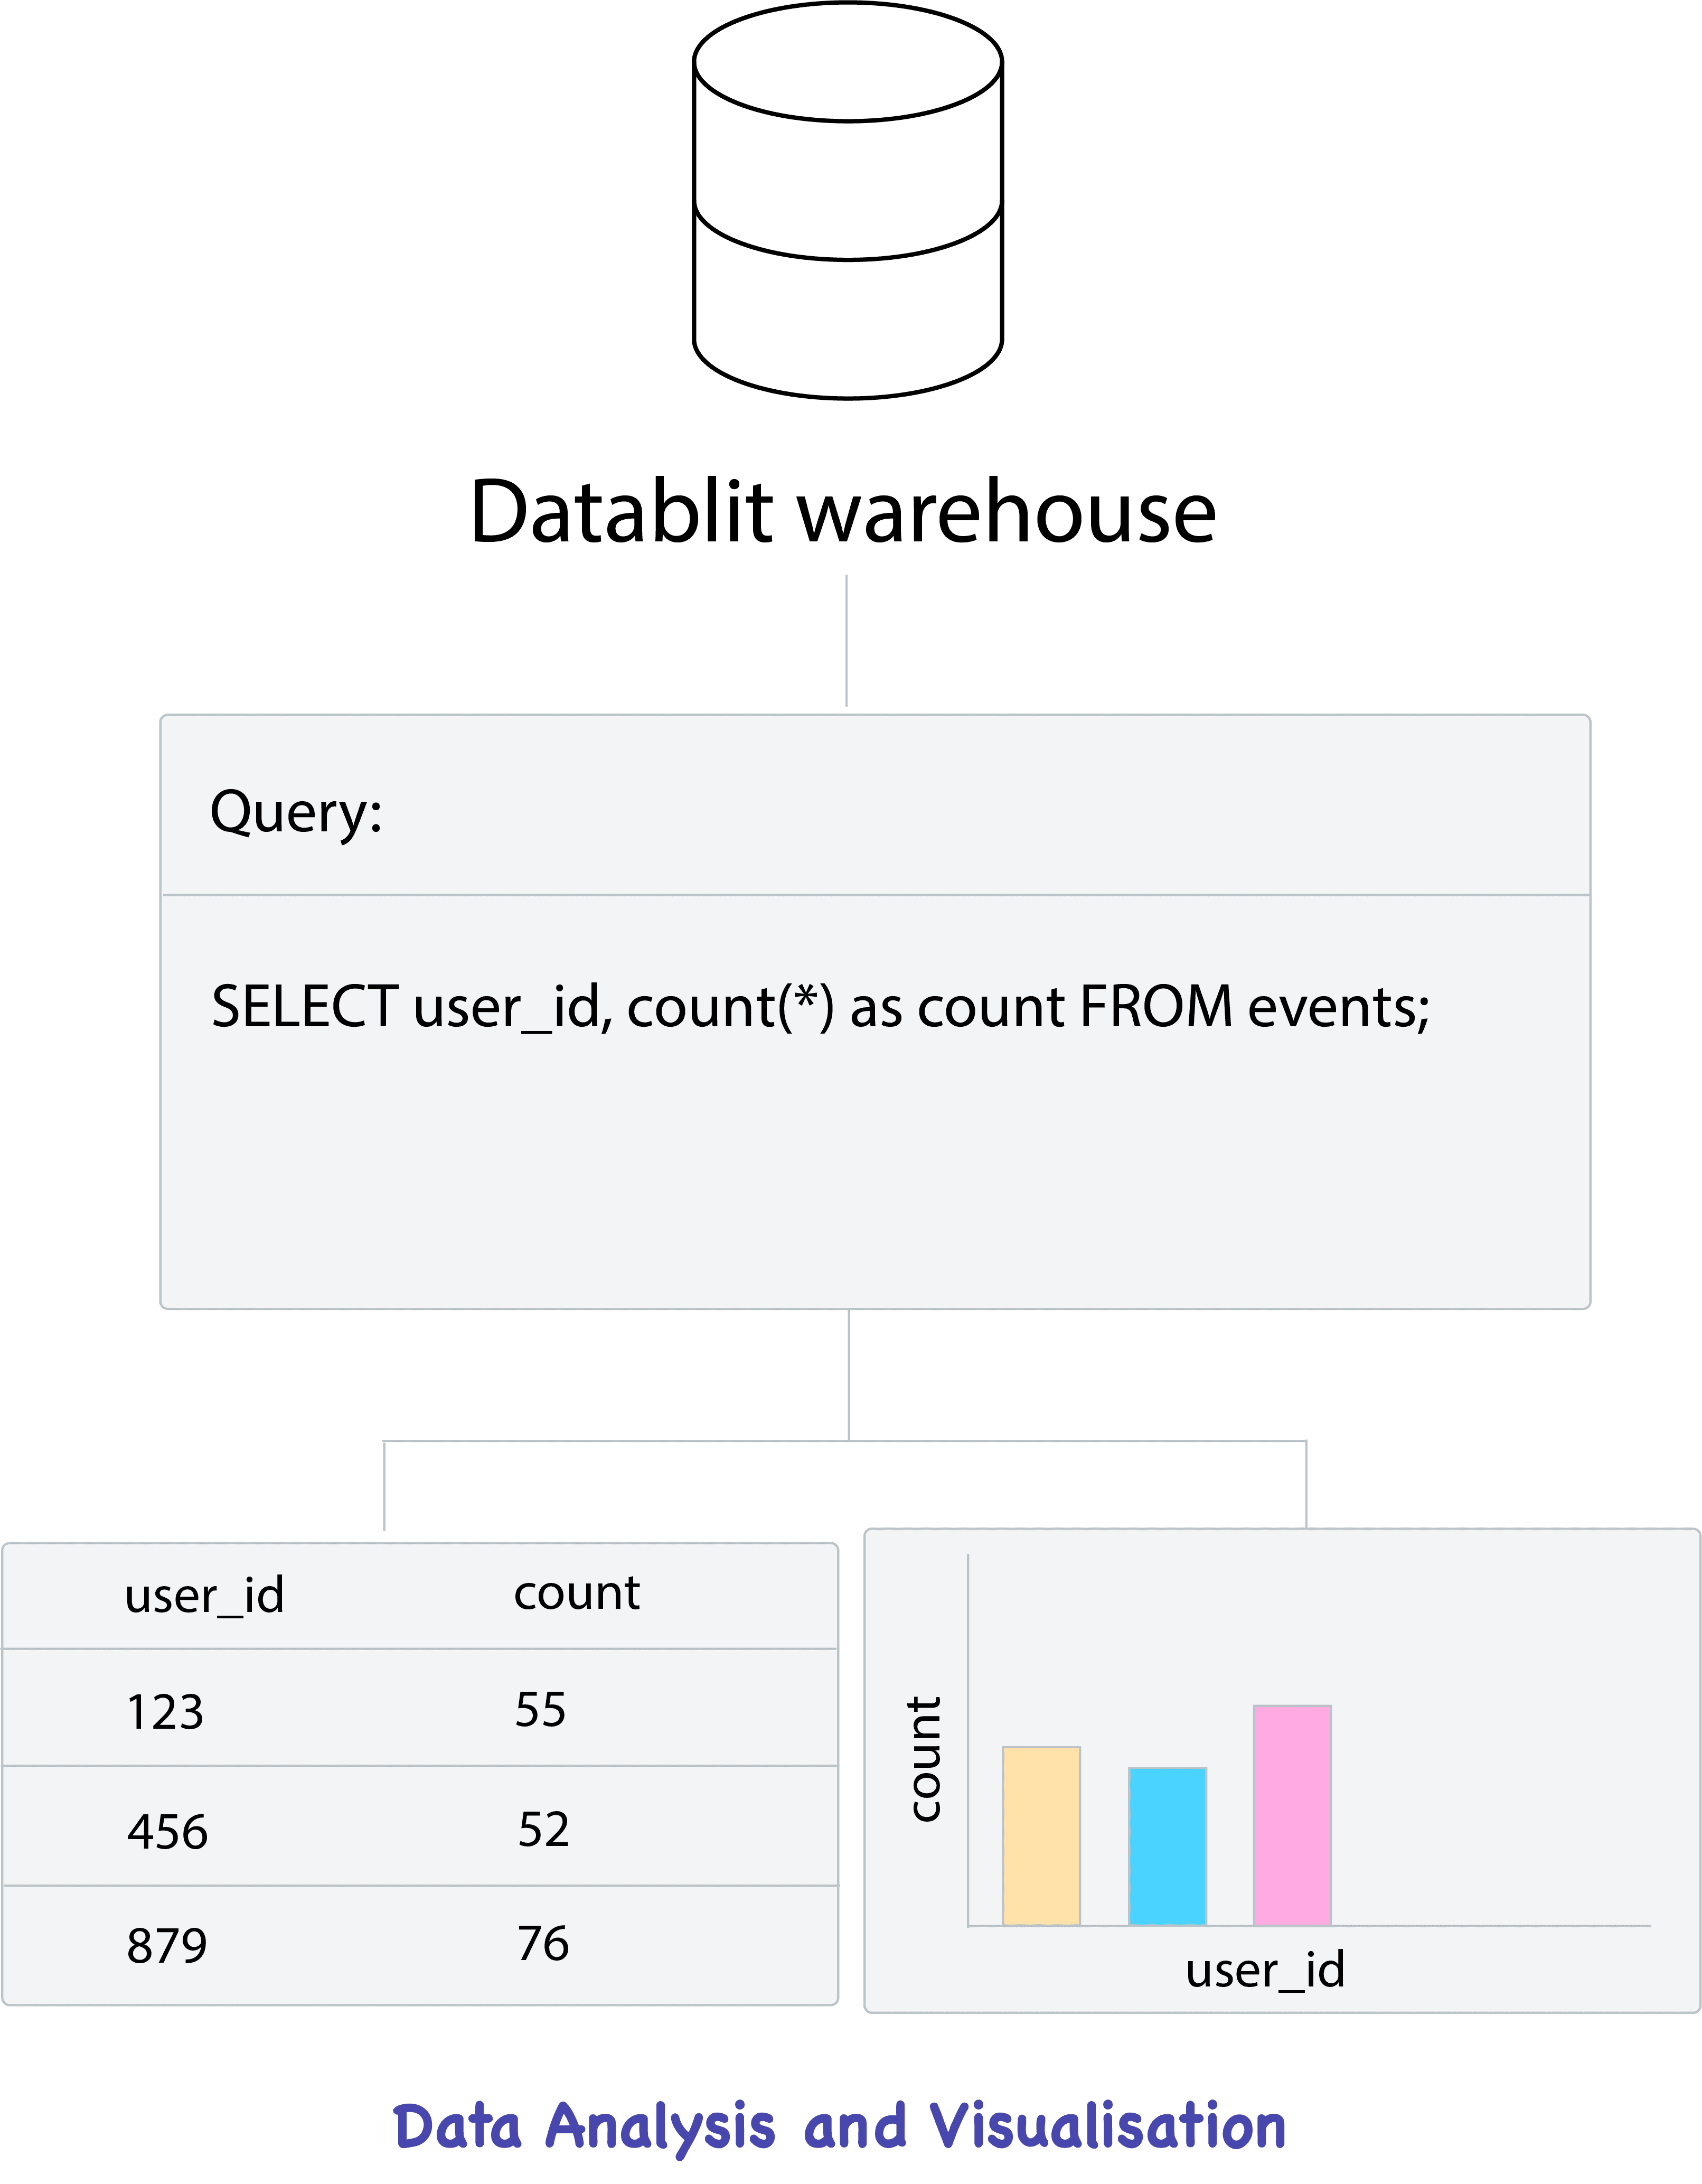
Data Analytics & Visualisation
Track, analyse and visualise customer data to uncover insights and support strategic business decision. Data exploration with graphs to discover and understand relevant patterns in data.
No credit card required · Setup in minutes

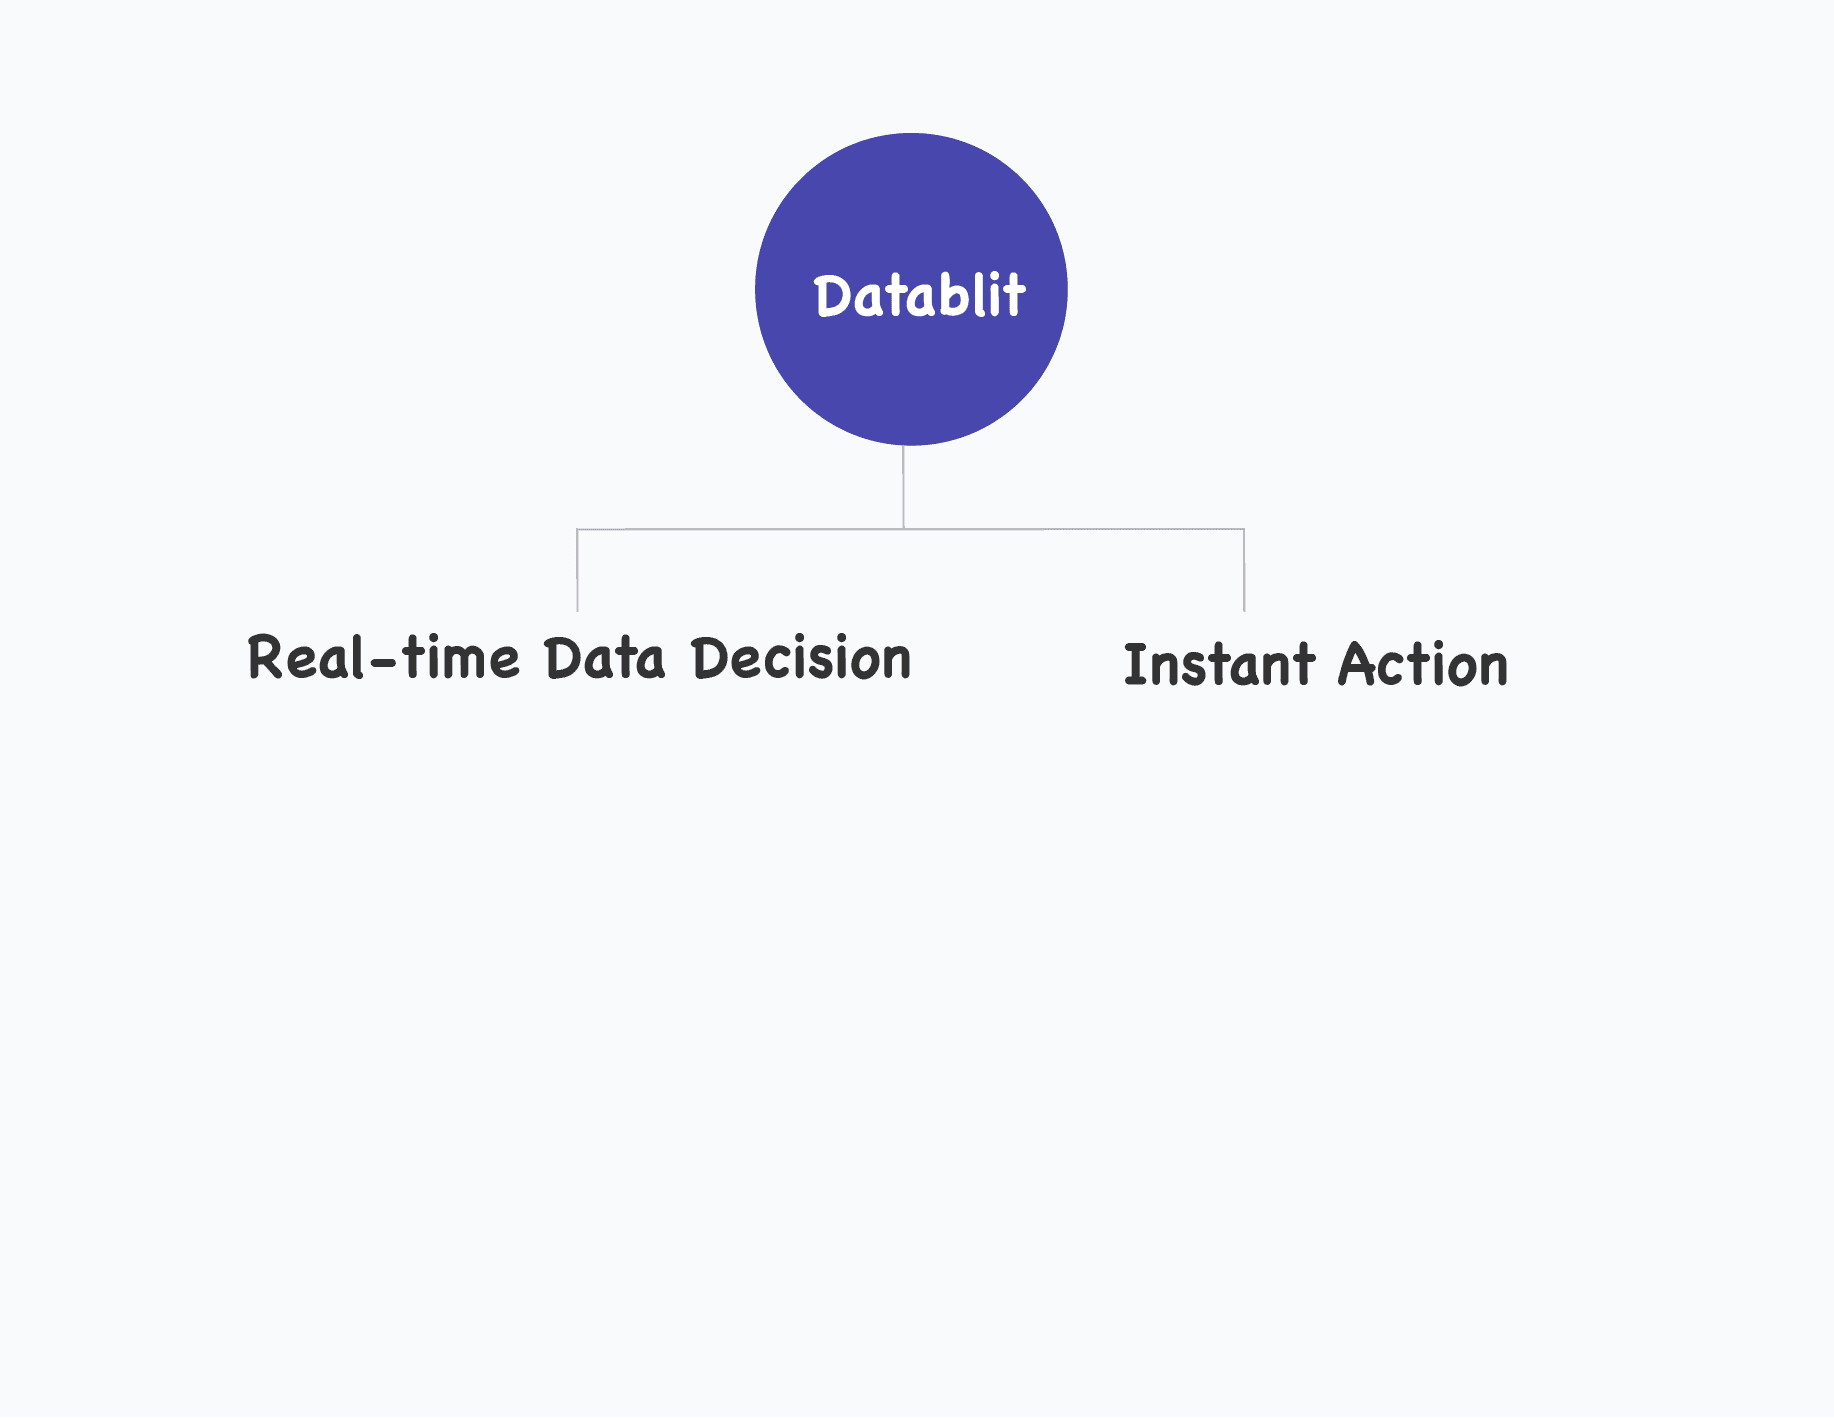
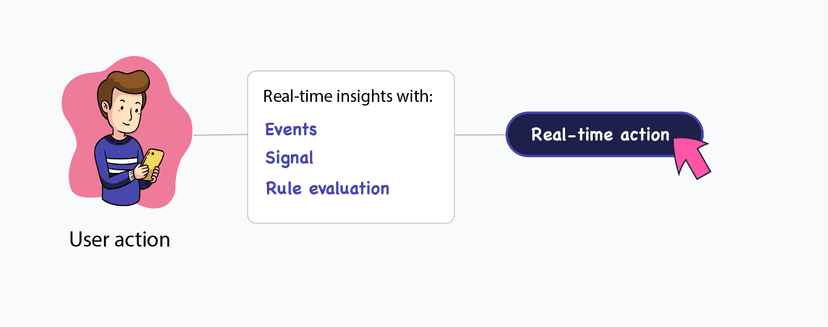
Turn Real-time insights into action
Harness continuous insights from both live and historical data, decode patterns, create strategies and drive growth. Extract real-time insights from event streams and handle millions of concurrent queries within seconds.
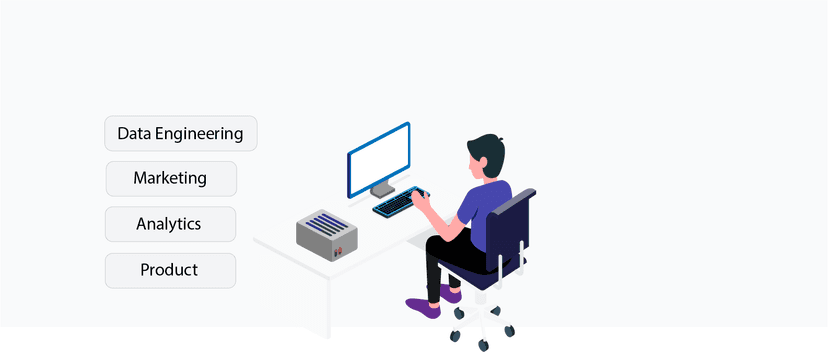
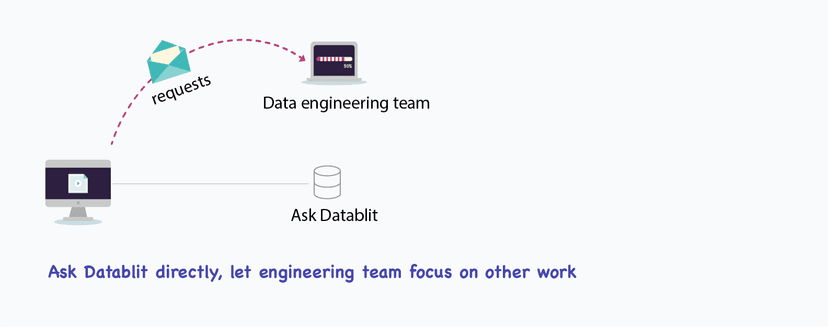
Self serve analytics
It ensures non technical teams to get access and analyse data anytime directly from the inbuilt warehouse, cutting dependence on data experts and speeding up data-driven decisions. No data duplication and loss, full traceability from data to decision.
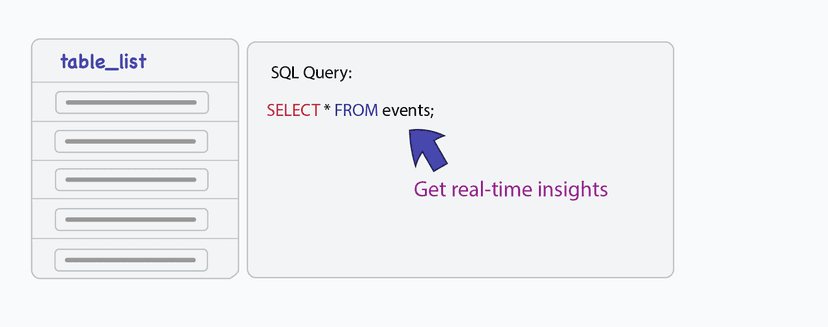
Scale analytics seamlessly
Run high performance analytics without the need for external query engines. With built-in support for SQL based querying exploration, enables seamless real-time insights and sharing across teams. Whether you are analysing streaming updates, historical data or computed data, Datablit ensures fast, efficient and scalable analytics.
Reduction in data related requests
Non technical teams need not to ask the data team for syncing data to the warehouse every time they need access for analysis. It ensures teams get actionable insights directly from the inbuit warehouse.
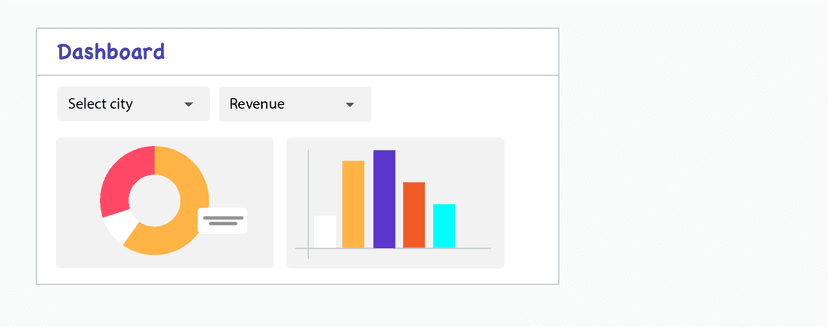
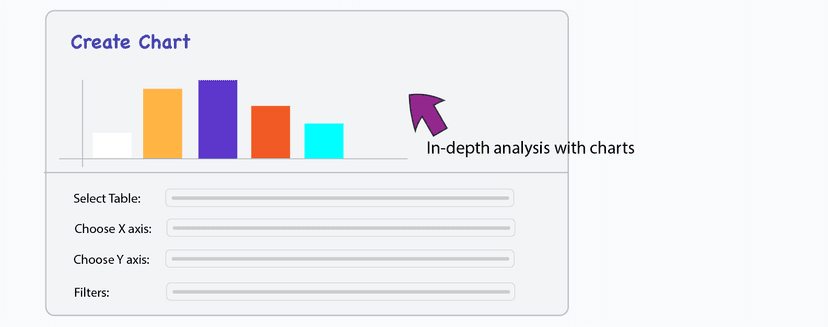
Data visualisation - Explore trends Remove guesswork
Build stunning visualisation and interactive reports that adapt in real-time to evolving data landscape. Identify trends and explore new opportunities
Build Dashboard
Curate charts and share your own custom set of dashboard to ensure you're keeping close tabs on metrics that matters most to your business.